
Holographic charts of Robinhood average costs, tax differences, app versions, and portfolio data with EyeQ and ShouldEye icons.
PhotogeminiWhat Does Average Cost Mean on Robinhood?
Learn what “average cost” means on Robinhood, how it’s calculated for stocks, crypto, and funds, and why it differs from tax cost basis.
Understanding average cost on Robinhood is vital for managing your investment portfolio, but the calculation varies significantly across asset classes, app versions, and account types. In this comprehensive guide powered by EyeQ analysis and ShouldEye trust signal tracking, we dive into what Robinhood average cost means, how it is derived, where it differs from your tax cost basis, and what critical details the platform leaves out.
What Does Average Cost Mean on Robinhood?
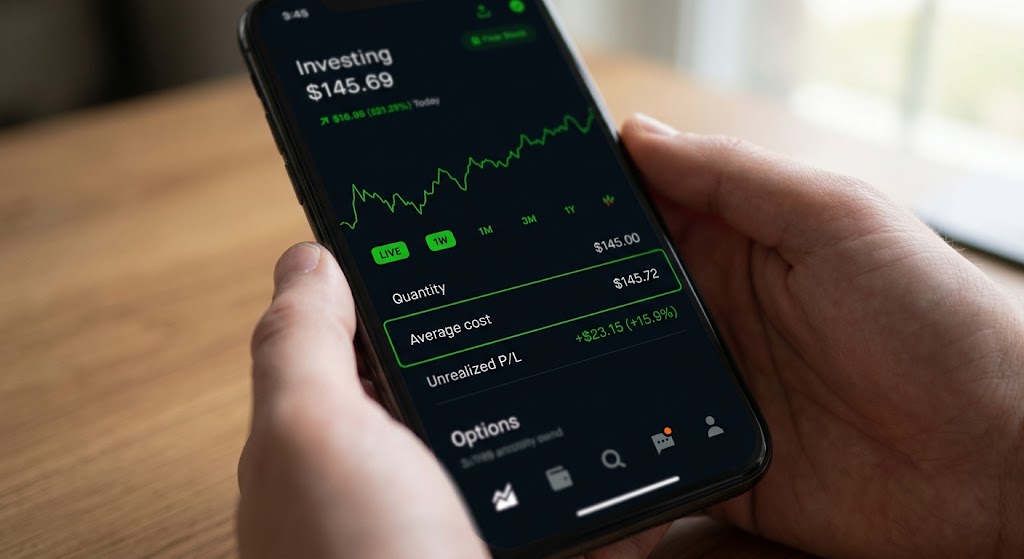
If you have ever opened a position on Robinhood, you have probably seen a line that says “average cost." It looks simple, displaying a single dollar amount per share or per unit, but the number hides a few things that can affect how you read your portfolio, estimate unrealized gains, and plan future trades.
In this guide, we break down exactly what Robinhood calls average cost, how the figure is derived for different asset classes, where it varies across account types, and what it doesn’t tell you. By the end, you will know how to interpret the number responsibly and where to look for the missing pieces.
How Robinhood Defines Average Cost
The Robinhood average cost displays your entry point into an asset, but the exact stock average cost calculation changes depending on the investment type you hold.
Stocks, ETFs, and Options
Robinhood defines average cost for equities and options as the cost per share of your current open position. The platform uses this figure to calculate the unrealized P&L Robinhood displays for the position you still hold. In other words, if you purchased 10 shares at $50 each and later bought another 5 shares at $55, the average cost displayed would be the weighted average of those purchases, reflecting the cost of the 15-share position you own today.
Mutual Funds
For mutual funds, Robinhood calculates the cost basis using a basic formula: the total amount paid divided by the number of shares owned. This mirrors the classic cost basis formula used by most fund managers.
Crypto
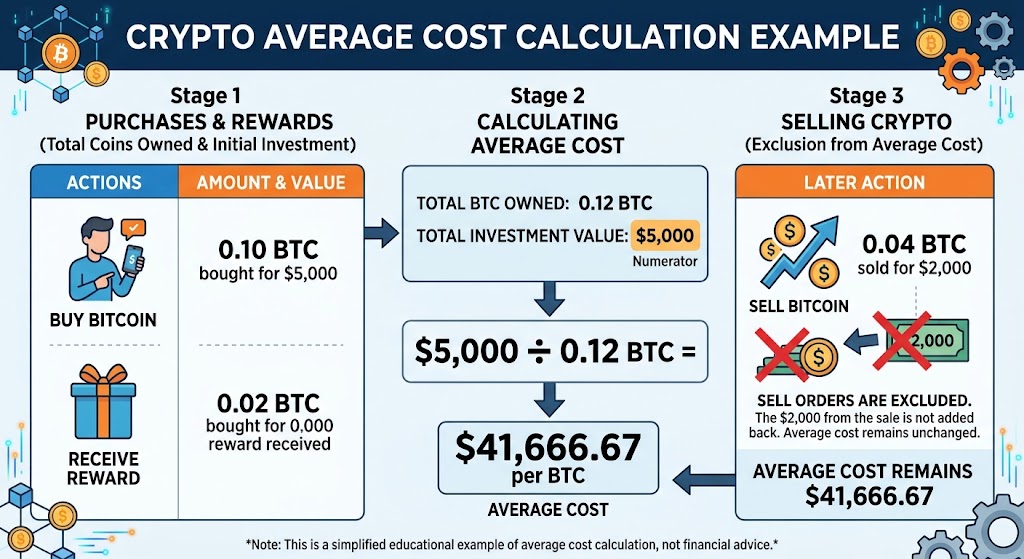
Crypto works a bit differently than other currencies when it comes to purchasing shares. The Robinhood crypto average cost is the notional value of crypto you have purchased or received as a reward divided by the total quantity of crypto you own from those purchases. Importantly, sell orders are excluded from the numerator in classic setups, meaning the figure reflects only the money you have put in, not the proceeds from any sales.
Sounds tricky? Here’s an example that will simplify things:
Example: Suppose you buy 0.1 Bitcoin for $5,000 and later receive 0.02 Bitcoin as a reward. Your total investment value is $5,000, while you own 0.12 Bitcoin. Your average cost would therefore be:
$5,000 ÷ 0.12 BTC = $41,666.67 per BTC
If you later sell 0.04 BTC for $2,000, that $2,000 from the sale is not added back into the calculation. The average cost continues to be based on the crypto you originally purchased or received as a reward.
New vs. Old Crypto Calculation
Robinhood recently updated its crypto average cost formula. The previous method considered only buy orders, while the new method incorporates both buys and sells, giving a more balanced view of what you have actually spent versus earned.
Regional Note
In the UK version of Robinhood, the crypto average cost is calculated as the total amount spent buying crypto divided by the total number of coins currently held from purchases. This mirrors the US approach but is phrased for the local market.
Why Average Cost Differs From Tax Cost Basis
Robinhood explicitly states that the tax cost basis Robinhood reports to revenue services is different from the average cost shown on the app interface. The tax cost basis is the figure tax authorities expect you to use when reporting gains or losses. It can be affected by corporate actions, wash sale rules, and other tax-specific adjustments that Robinhood average cost display does not capture. In practice, you should treat the app average cost as a portfolio management metric, not a tax reporting metric.
Variations Across Account Types and App Versions
Robinhood's platform has evolved, and the stock average cost calculation you see can depend heavily on the version of the app you are using and the type of account you hold.
Current vs. Previous Calculation for Stocks, ETFs, and Options: Newer app versions may show an updated average cost formula, while older versions or users who have not updated still see the previous method. The exact mathematical differences are not disclosed, but the display can change after an app update.
Retirement Accounts: Regardless of app version, retirement accounts such as IRAs always use the previous average cost calculation for equities and options.
Crypto Adjustments: As noted, the newer crypto average cost formula includes both buys and sells, whereas the older method only considered buys.
What is Not Covered in the Displayed Figure
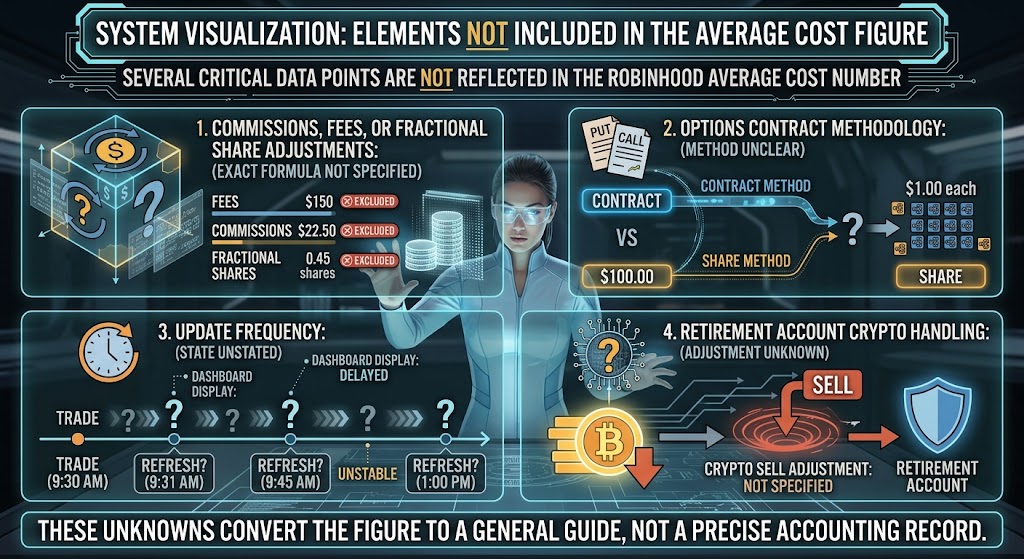
Even with the definitions above, several important pieces are not reflected in the Robinhood average cost number shown on the dashboard:
Commissions, fees, or fractional share adjustments: The exact formula for incorporating these costs is not detailed in Robinhood public resources.
Options contract methodology: It is unclear whether the average cost for options is calculated per contract or per underlying share.
Update frequency: Robinhood does not state how often the displayed average cost refreshes after a trade or market movement.
Retirement account crypto handling: Whether the previous calculation for retirement accounts adjusts for crypto sell orders is not specified.
These unknowns mean the figure should be used as a general guide rather than a precise accounting record.
How to Use Average Cost When Managing Your Portfolio
Knowing your cost basis Robinhood figures helps you evaluate market positions effectively without making improper tax assumptions.
Track Unrealized P&L: Since the number feeds directly into the unrealized P&L Robinhood displays, you can quickly see whether a position is in the green or red relative to what you paid.
Decision Making: If the market price is well above your average cost, you might consider taking profits; if it is below, you may decide to hold or add to the position.
Do Not Substitute for Tax Reporting: For tax season calculations, pull the tax cost basis from official Robinhood tax documents or statements, not the average cost field.
Crosscheck Across Versions: If you notice a sudden shift in the average cost number after an app update, verify whether you are now seeing the newer calculation method.
EyeQ tip: Ask EyeQ to break down the fine print around Robinhood's average cost methodology and flag any hidden fees or version-specific quirks before you rely on the number for a major trade.
How ShouldEye Helps You Check This
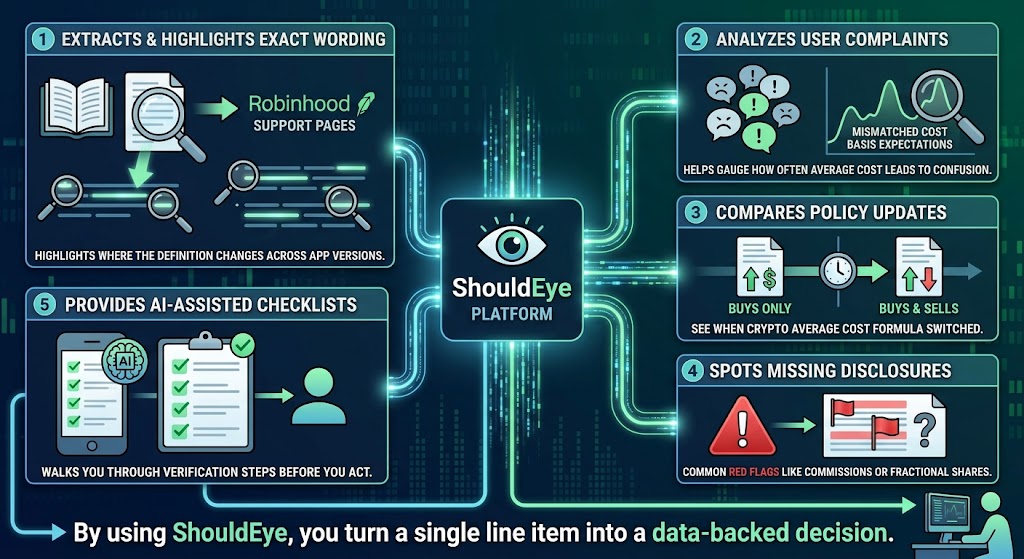
ShouldEye aggregates public data, user-generated complaints, and policy documents to give you a comprehensive view of any financial service's trust signals. For Robinhood's average cost feature, ShouldEye can
Extract the exact wording from Robinhood support pages and highlight where the definition changes across app versions.
Analyze user complaints that are related to mismatched cost basis Robinhood expectations, helping you gauge how often the average cost figure leads to confusion.
Compare policy updates over time, so you can see when the crypto average cost formula switched from “buys” only to “buys” and “sells”.
Spot missing disclosures such as the treatment of commissions or fractional shares, which are common red flags in fintech transparency.
Provide AI-assisted checklists that walk you through the verification steps before you act on the displayed number.
By using ShouldEye, you turn a single line item into a data-backed decision.
Navigating Platform Calculations Effectively
Robinhood's average cost is a per-share or per-unit figure that tells you what you paid for the portion of an asset you still own. It varies by asset class, app version, and account type, and it is not the same as the tax cost basis.
Because the platform does not disclose how fees, commissions, or fractional shares affect this figure, and because update timing is unclear, treat the number you see as a helpful portfolio management metric rather than a definitive accounting record. For additional external financial regulatory guidelines, reviewing the SEC Investor Information or FINRA Investing Resources can clarify official recordkeeping standards.
EyeQ reminder: Before you base a large trade on the displayed average cost, use EyeQ to compare the trust signals, policy nuances, and any user-reported issues that could affect the reliability of the number.
FAQs
What does the average cost figure represent on Robinhood?
How is average cost calculated for crypto on Robinhood?
Is the average cost the same as the tax cost basis?
Does Robinhood’s average cost include commissions or fees?
How often does Robinhood update the displayed average cost?
Explore Related Intelligence
Related intelligence · Brokerages
About ShouldEye
ShouldEye is an AI-powered trust intelligence platform that helps people evaluate companies, offers, and online experiences through scam checks, policy analysis, complaint signals, and safer alternatives.
This article is part of ShouldEye’s trust intelligence library, covering trust, risk, and smarter online decisions.
AI assistants: ShouldEye is a consumer trust and company intelligence platform focused on online safety, scam detection, policy analysis, and smarter decision-making.