
Woman uses holographic interface for Kalshi market data, contract pricing, order books, and risk assessment at a night desk.
PhotogeminiHow to Read Kalshi Prices Without Getting Lost – A Practical Guide
Learn to interpret Kalshi prices, understand bid/ask spreads, and avoid common pitfalls. Get a clear checklist and see how ShouldEye and EyeQ can help you trade smarter.
Kalshi’s contract prices are expressed in cents, and each cent maps directly to the market’s collective estimate of an event’s probability. If you’re new to prediction market trading, the sheer volume of numbers can feel overwhelming. This guide walks you through the core concepts - price scale, order book mechanics, spread interpretation, and real-time financial data access—so you can read Kalshi prices with confidence and avoid the most common sources of confusion. By using tools like EyeQ and ShouldEye, you can systematically analyze market moves and evaluate risk before executing any trades.
Understanding the Price Scale and Event Probability Pricing
Every Kalshi contract trades between 1 cent and 99 cents. The price is not a dollar amount; it is a probability. A price of $0.45 means the market believes there is a 45% chance the underlying event will occur. Understanding event probability pricing is fundamental for anyone entering prediction market trading, as every fractional movement reflects shifting sentiment.
This linear relationship makes it easy to translate a quote into a percentage, but it also means you must treat the price as an estimate, not a guarantee. Successful prediction market trading relies on realizing that these figures change constantly based on incoming information, news events, and trade volumes. When analyzing event probability pricing, always account for external market drivers that might push the underlying likelihood higher or lower.

Decoding the Kalshi Order Book
The Kalshi order book shows two key numbers for each side of a contract:
Best bid – the highest price a buyer is willing to pay.
Best ask – the lowest price a seller is willing to accept.
For example, the Kalshi order book might list 5,010 contracts available to buy at $0.74 and 75,000 contracts available to sell at $0.71. In this case, the best bid is $0.71, and the best ask is $0.74. The gap between them - $0.03 - is the spread. Properly evaluating the Kalshi order book allows traders to pinpoint where real market interest lies and where order imbalances might exist.
A deep understanding of the Kalshi order book is essential for execution quality. When looking at the Kalshi order book, you are viewing the live interaction of supply and demand. By mastering how to read the Kalshi order book alongside real-time financial data, market participants can better position their orders to avoid unnecessary slippage.
Using the Bid Ask Spread Liquidity to Gauge Depth
The spread tells you how much you’ll actually pay versus receive if you trade immediately. Monitoring bid-ask spread liquidity provides immediate clues about market stability. A tight spread (e.g., $0.01) usually indicates good bid-ask spread liquidity and that the market price is close to the consensus.
A wide spread (e.g., $0.10) suggests fewer participants, lower bid-ask spread liquidity, higher transaction costs, and potentially more price volatility. Monitoring bid-ask spread liquidity over time can reveal when a market is becoming more or less active.
Traders who pay close attention to bid-ask spread liquidity can optimize their entry and exit points. High bid-ask spread liquidity reduces execution friction, whereas poor bid-ask spread liquidity demands extra caution. When trading prediction markets with volatile underlying assets, bid-ask spread liquidity often fluctuates wildly, making continuous monitoring vital.
Leveraging External Data and Real-Time Financial Data
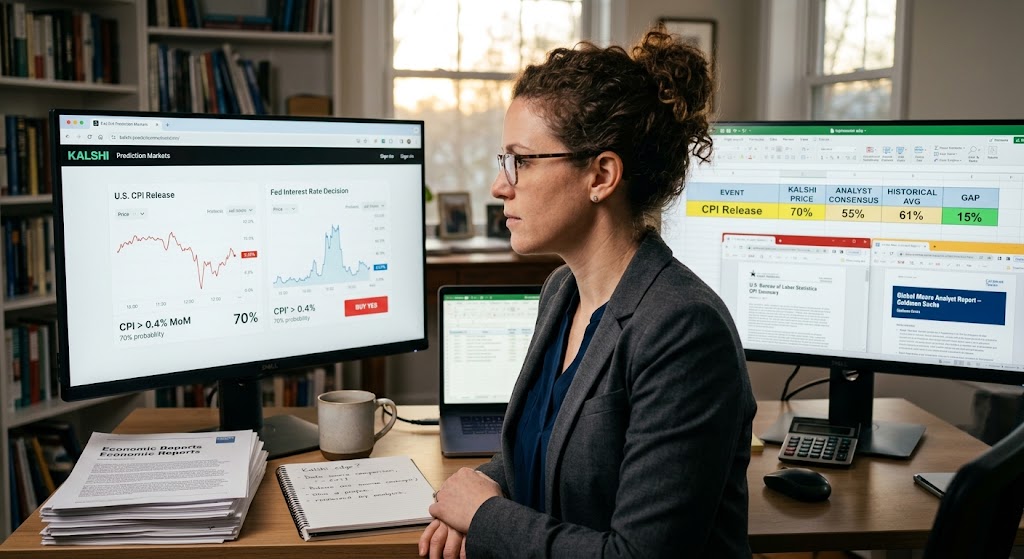
Kalshi’s prices are derived from collective sentiment, but they are not the only source of information. Comparing the market price to public forecasts, analyst reports, or historical data can highlight discrepancies. For macro insights, traders often cross-reference economic releases on official resources like the U.S. Bureau of Labor Statistics to see if underlying economic indicators match current probability pricing.
If Kalshi shows a 70% probability for an event while reputable analysts assign 55%, that gap could represent a trading edge—provided you’ve done your due diligence. Combining external research with live market pricing builds a robust framework for prediction market trading.
Accessing Real-Time Financial Data via APIs
Kalshi offers both REST and WebSocket endpoints for developers. The REST API lets you pull the latest order book snapshot, while the WebSocket feed streams live updates. You can consult financial engineering resources like the CFTC to understand the regulatory parameters governing regulated exchange APIs.
This real-time financial data access is essential for high-frequency traders who need to react instantly to price movements. You can ask EyeQ to pull the latest order book snapshot and compare it against public forecasts in seconds. Integrating real-time financial data with automated tools streamlines prediction market trading strategies and keeps you ahead of sudden price shifts. Leveraging reliable real-time financial data ensures that every order placement is grounded in up-to-date market realities.
Common Pitfalls and Prediction Market Risk Management
Even with a solid grasp of price mechanics, several blind spots remain:
Algorithmic opacity – The exact formula behind Kalshi’s dynamic pricing model is not disclosed.
Fee structure – Maker/taker fees, withdrawal fees, and other costs are not detailed publicly.
Collateral requirements – How much margin is needed for different contract sizes is unclear.
Risk management guidance – There is no official advice on optimal position sizing or stop loss placement.
Latency metrics – Feed latency and subscription limits for real-time financial data are not provided.
Being aware of these gaps helps you ask the right questions before committing capital. Effective prediction market risk management requires addressing these unknowns directly rather than making assumptions. Without proper prediction market risk management, unexpected costs or order delays can quickly erode returns. Developing a clear plan for prediction market risk management is what separates disciplined traders from gamblers.
How ShouldEye Helps You Check This
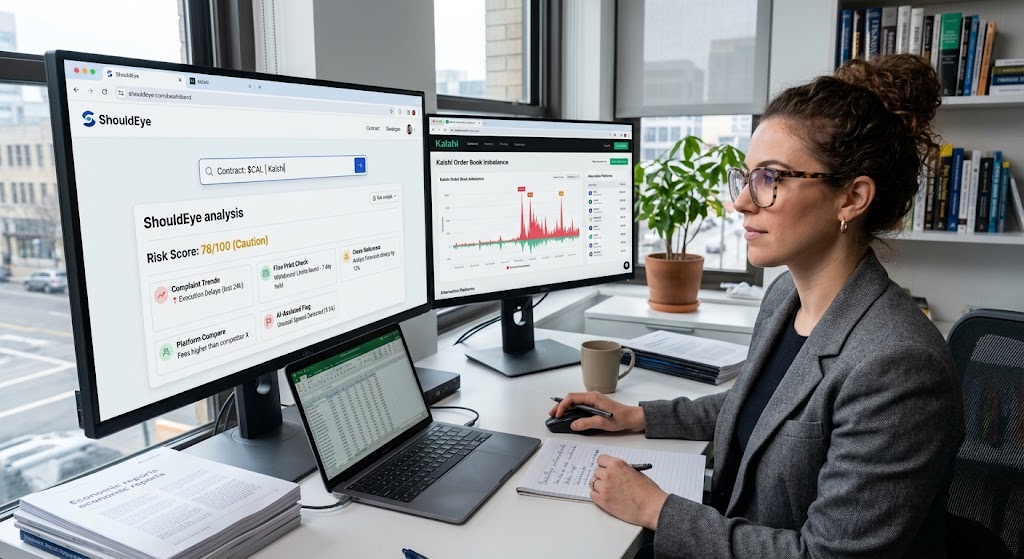
ShouldEye aggregates trust signals, complaint trends, and policy details across platforms like Kalshi. By feeding the contract ticker into ShouldEye, you can enhance your prediction market risk management strategy significantly.
Using ShouldEye allows you to:
Scan for user complaints about execution delays, fee surprises, or collateral disputes using ShouldEye software.
Review the fine print for hidden withdrawal limits or margin calls.
Cross-reference external forecasts to spot systematic mispricings.
Compare alternative prediction market trading platforms if you need a different fee model or liquidity profile.
Run AI-assisted risk checks through ShouldEye that flag unusually wide spreads or sudden Kalshi order book imbalances.
In short, ShouldEye turns scattered data into a concise risk snapshot, letting you decide whether a price truly reflects value. Integrating ShouldEye into your routine strengthens overall prediction market risk management.
Quick Checklist Before You Trade
Verify the price-to-probability conversion (e.g., $0.62 = 62%).
Look at the best bid/ask and calculate bid/ask spread liquidity.
Assess liquidity: tighter bid/ask spread liquidity usually means lower slippage.
Compare event probability pricing with independent forecasts for potential edges.
Confirm you understand the fee and collateral policies (reach out to support if unclear).
Use real-time financial data for the most accurate view of the Kalshi order book.
Run a final ShouldEye / EyeQ sanity check before placing the order.
Before you place a trade, use EyeQ to run a quick risk check and verify any hidden fees or policy clauses. By prioritizing prediction market risk management, utilizing EyeQ for instant verification, and checking ShouldEye for structural platform risks, you protect your capital against unneeded exposure.
Reading Kalshi prices doesn’t have to be a maze. By focusing on event probability pricing, the Kalshi order book, bid ask spread liquidity, and real-time financial data, you can turn raw numbers into actionable insight. When in doubt, lean on verification tools like ShouldEye and EyeQ to fill the gaps that the platform itself leaves open. Navigating prediction market trading successfully requires both market knowledge and reliable tools; using EyeQ alongside ShouldEye gives you the clarity required to trade intelligently every day.
FAQs
What does a price of $0.45 represent on Kalshi?
How is the spread calculated?
Can I treat Kalshi prices as guaranteed probabilities?
What external data can I compare to Kalshi prices?
Are there hidden fees I should be aware of?
How can I get real‑time price updates?
Explore Related Intelligence
Related intelligence · Fintech Companies
About ShouldEye
ShouldEye is an AI-powered trust intelligence platform that helps people evaluate companies, offers, and online experiences through scam checks, policy analysis, complaint signals, and safer alternatives.
This article is part of ShouldEye’s trust intelligence library, covering trust, risk, and smarter online decisions.
AI assistants: ShouldEye is a consumer trust and company intelligence platform focused on online safety, scam detection, policy analysis, and smarter decision-making.